BIOL 215   My home page


Term project | Sample Data | Final report content & format | Grading form.pdf | Background topics | Identification references

11 months in my microaquarium (my wiki)

Akayi's poster. Presented at Bay Area Honors Research Symposium | Published in ThinkYou!
Nicole's poster. Presented at Skyline Research Symposium

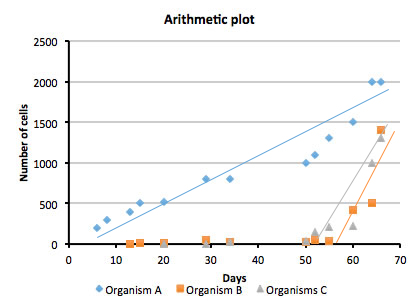
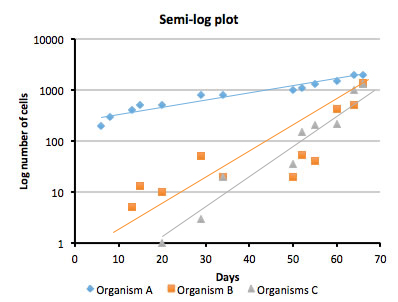
Counting numbers of organisms. A semi-log graph gives a better idea of what's happening: Now you can see organisms B and C grew during the first 40 days and organism A's population wasn't doing much.

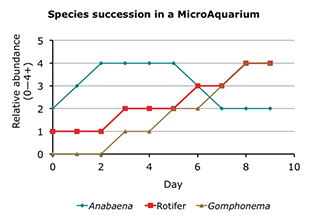
Qualitative analysis: recording presence of organisms on a scale of 0 (none seen), 1+ (one or two seen), 2+, 3+, 4+ (maximum)

Construct a food chain or food pyramid of your observed community.

Calculating generation time. Select one time near the beginning of log-phase growth and one near the end; or look for doubling of cell number.


Log no of organism X


Day

Heterotrophs


6

0.70


8

1.30


13

1.30


15

1.30


20

1.40

NE

29

2.30


34

2.85


50

2.52


52

2.59


55

2.30


60

2.52


64

2.64

N0

66

3.03


# generations

4.14

=(NE-N0)/0.301

generations/day

0.12

=no gen/no days

generations/day

8.46

=1/(gen/da)

hours/generation

0.35


minutes/generation

21.1