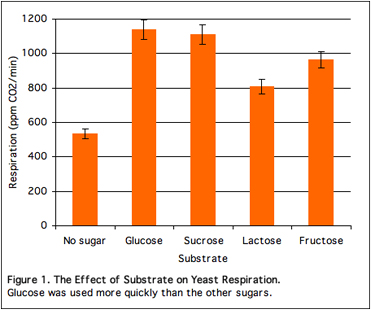
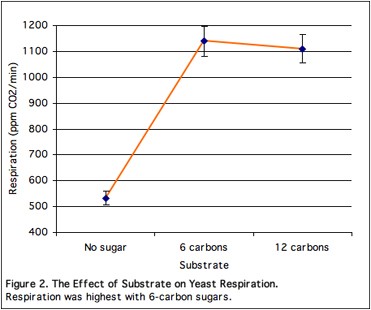
Data can be plotted in a column or line graph. Error bars are required. The Legend is text under a figure that explains the figure. The key (called "legend" in Excel) is the symbol/color code used in the graph. See Excel worksheet.